Pick a district you know in North Rhine-Westphalia (NRW), Germany. In this tour, you’ll compare its charging coverage for electric vehicles (EV), propose a station and find the datasets behind the map.
The NRW Charging Atlas README lists three local addresses: the dashboard, GeoNode and GeoServer. I’ll walk through what to open and what to check in each. You can follow this guide on its own; my project write-up explains why I built the scoring model this way.
1. Start the project
For a first run, clone the repo and bootstrap the stack:
git clone https://github.com/zhittsova/nrw-charging-atlas.git
cd nrw-charging-atlas
uv sync --frozen
uv run python -m scripts.project_stack bootstrap
You’ll need Git, Python 3.11+, uv and Docker Compose 2.24.4+. Allocate at least 4 CPUs and 4 GiB of RAM to Docker, with memory left for your host and browser. The first run downloads the pinned GeoNode source, container images and roughly 1 GB of public data, so allow tens of minutes. The frontend builds inside Docker, so you don’t need Node.js on your machine.
Once bootstrap finishes, these addresses open services on your own machine:
| Address | What you’ll find |
|---|---|
http://localhost:8081 | Dashboard: compare districts and try proposed stations. |
http://localhost:8000 | GeoNode: browse the published datasets and their metadata. |
http://localhost:8080/geoserver | GeoServer: inspect the map and feature services. |
If you’ve already bootstrapped the project, use uv run python -m scripts.project_stack start.
The setup guide
covers configuration and troubleshooting.
2. Choose a district in the dashboard
Open http://localhost:8081 and let the data finish loading. The notice above the map tells you
whether you’re looking at live data or a saved snapshot.
Choose Priority, Readiness or Charging gap in the ranking panel, then select a district. You can also select it directly on the map. The panel shows its charging supply and scores. Expand District evidence, quality and method context to see the components, source years and coverage notes.
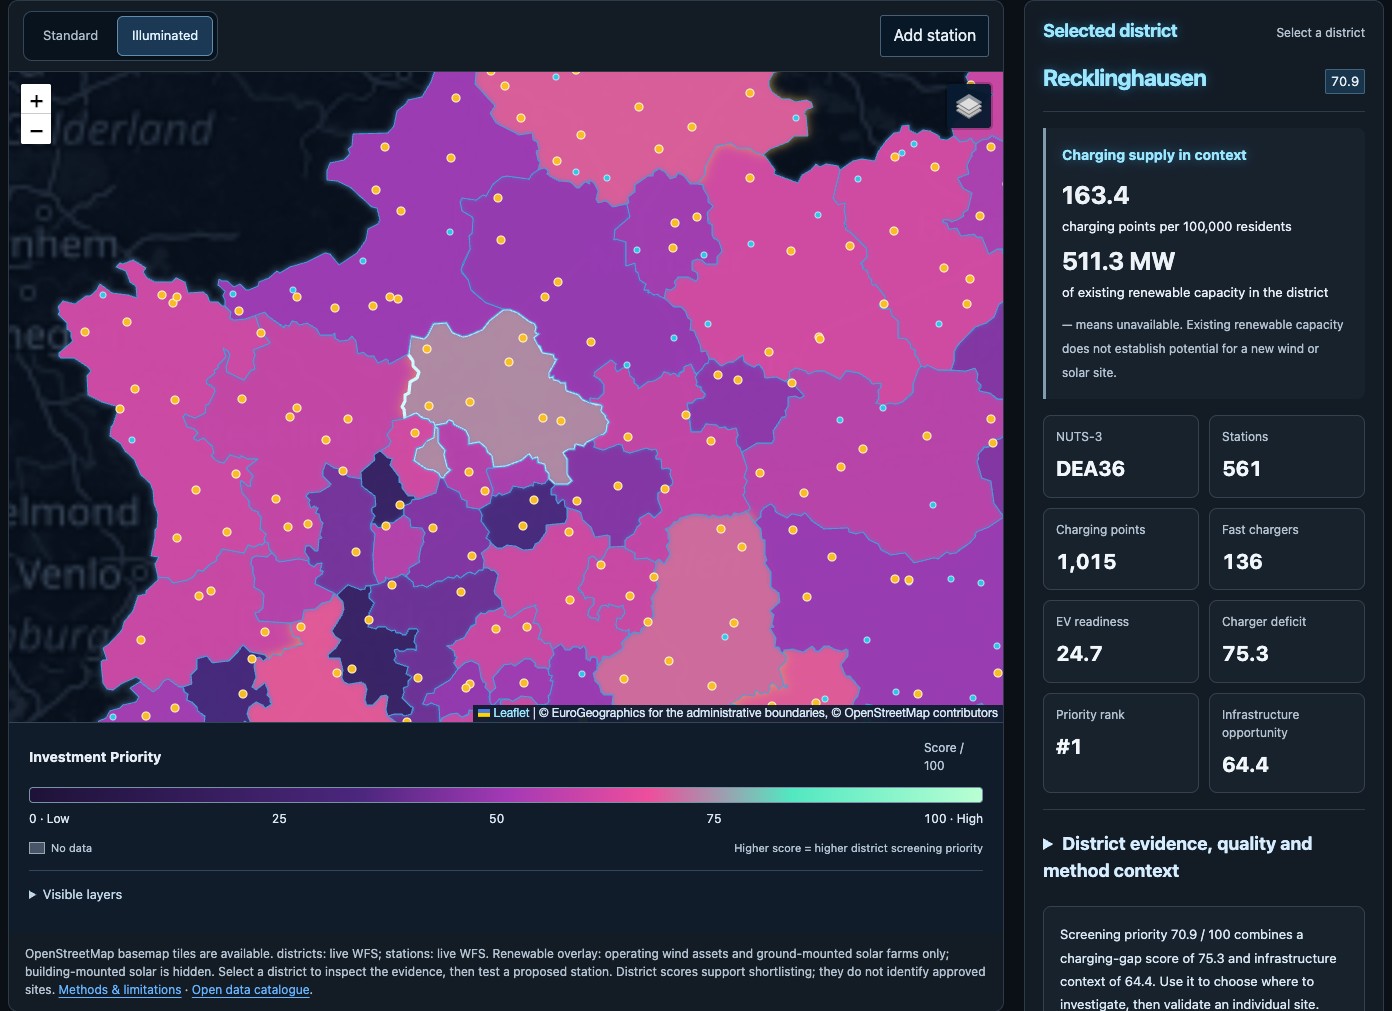
Recklinghausen selected in the dashboard. The score helps you choose where to investigate; checking a specific site still needs local demand, land and grid information.
3. Try a proposed station
Choose Add station, then click a location on the map. Give the proposal a name and enter its charging-point count, total station power and maximum power per point. You can adjust the latitude and longitude in the form too. If you’re using a keyboard, focus Add station and press Enter to open the form directly.
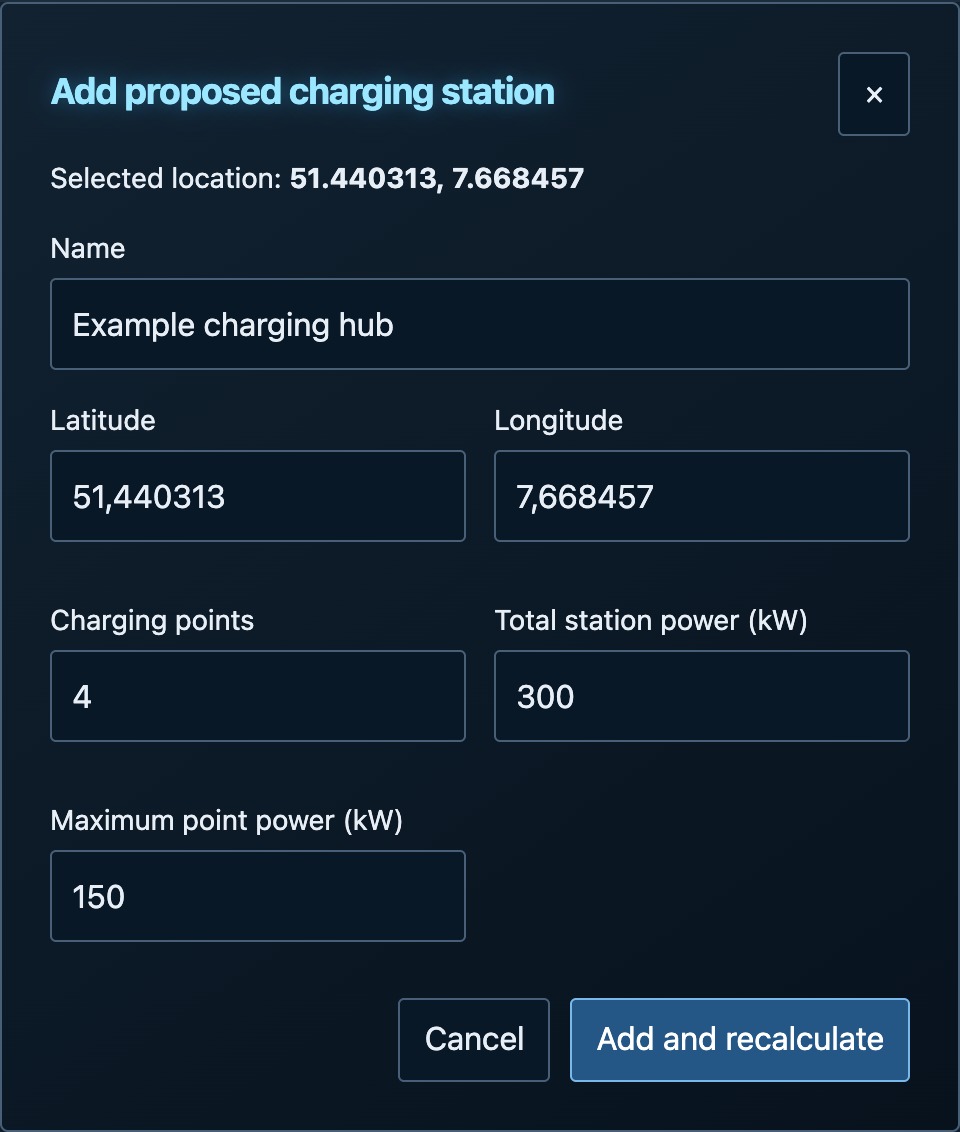
This example has 4 charging points, 300 kW of total station power and a maximum of 150 kW per point. The screenshot shows the form before saving.
Choose Add and recalculate to save your proposal. Under Map & comparison, switch between Current network, With proposals and Difference to inspect its effect. The proposal stays saved across restarts, and you can remove it from the proposed-stations list.
Only measures that depend on chargers change. The scenario keeps the existing population, traffic and grid data.
4. Browse the datasets in GeoNode
Open http://localhost:8000, then choose Datasets. You can also go straight to
http://localhost:8000/datasets#/.
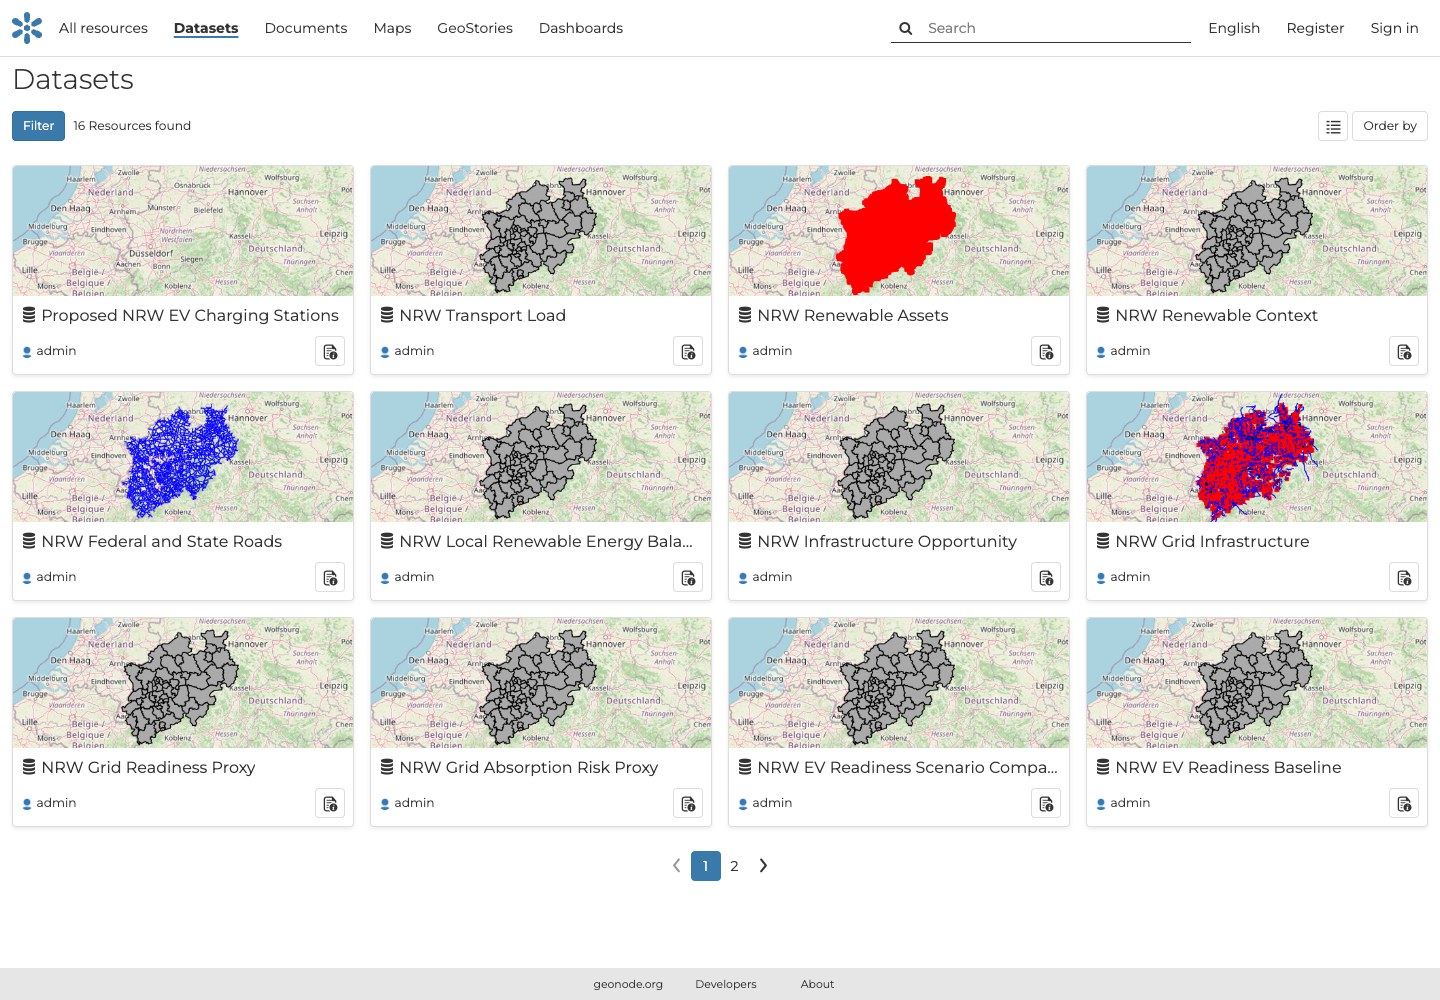
This catalogue brings together the published charging, energy, transport and infrastructure layers. Map previews: © EuroGeographics for the administrative boundaries, © OpenStreetMap contributors.
The proposed-stations preview starts empty. Add a station in the dashboard to put a proposal in that layer. Several district previews look alike because they share boundaries and a default polygon style. Open their attributes or compare them in the dashboard to see the different values.
Open a dataset card to explore that layer and its metadata. For example, NRW EV Readiness Baseline is the district layer behind the current-network comparison. The search and filter controls help you find a particular topic without going through every card.
5. Look at the services in GeoServer
Open http://localhost:8080/geoserver and choose Layer Preview. This lists the layers
GeoServer publishes and the preview formats available for each one. Find NRW EV Readiness
Baseline, named nrw:nrw_ev_baseline_metrics. Its row offers an OpenLayers map preview;
All Formats also includes GeoJSON if you want to inspect the feature data.
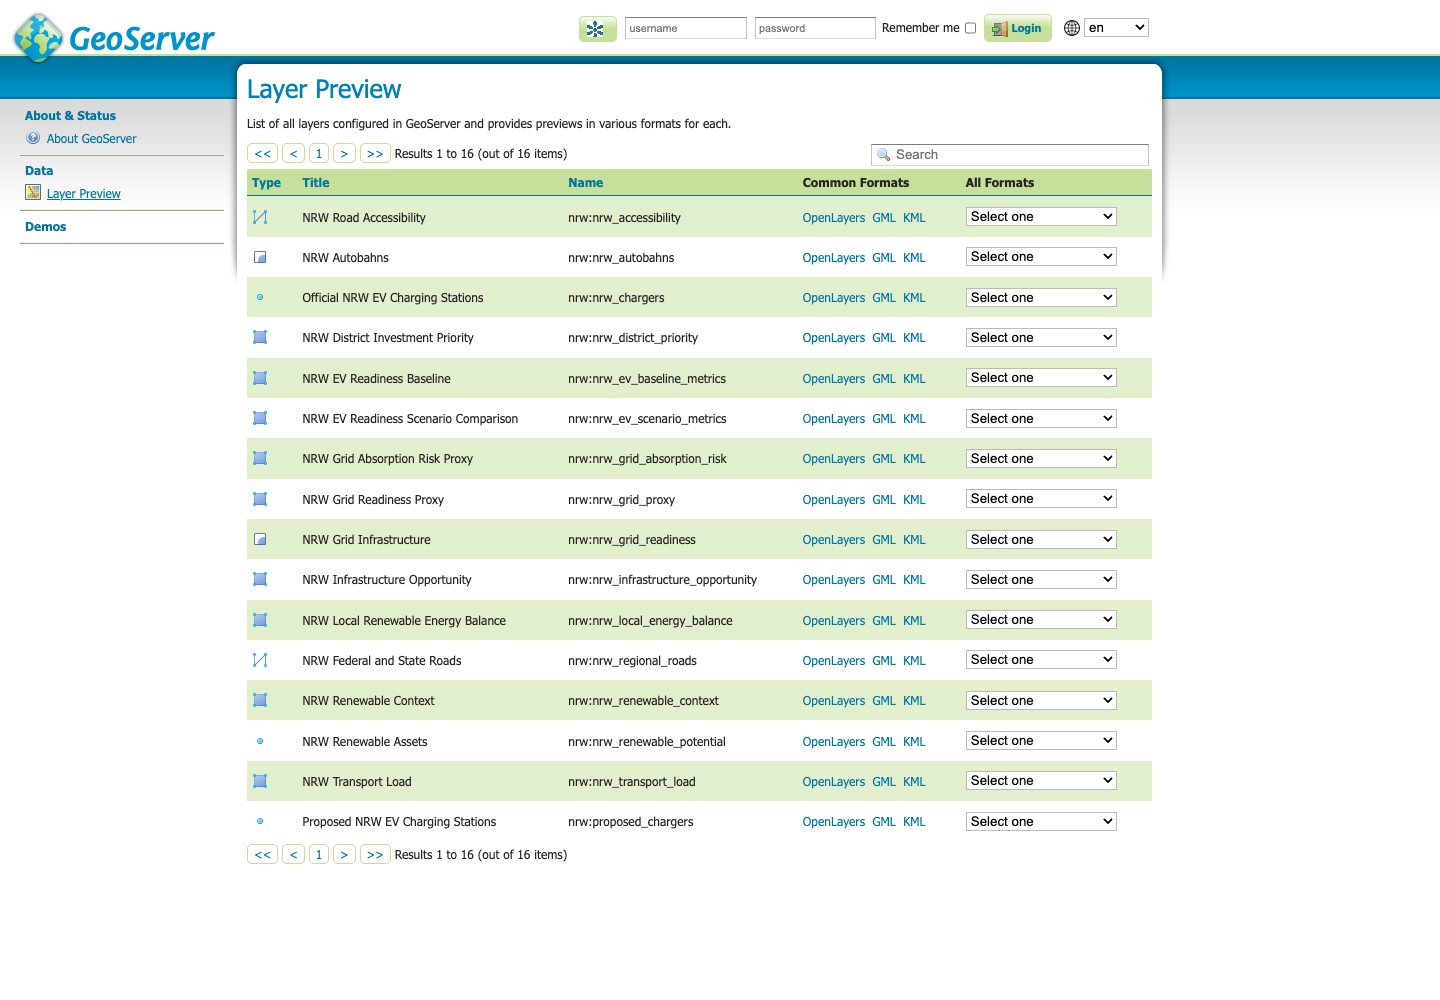
GeoNode helps you find and understand a dataset. GeoServer exposes it through map and feature services. From the welcome page, you can open the WMS or WFS capability links to see what each service offers. WMS serves rendered maps; WFS provides the features and their attributes. You can browse these pages without changing the server configuration.
When you’re done
Stop the stack with:
uv run python -m scripts.project_stack stopThis preserves the database and your proposals for the next start. You can check the services
with uv run python -m scripts.project_stack status.
For a useful next comparison, go back to the dashboard and try Charging gap, then Priority. Look at a district that changes position and check which components explain the difference.